
New Jersey Housing Age by Town
The median New Jersey home in our service area was built in 1964, and about 65% of the housing stock predates 1978.
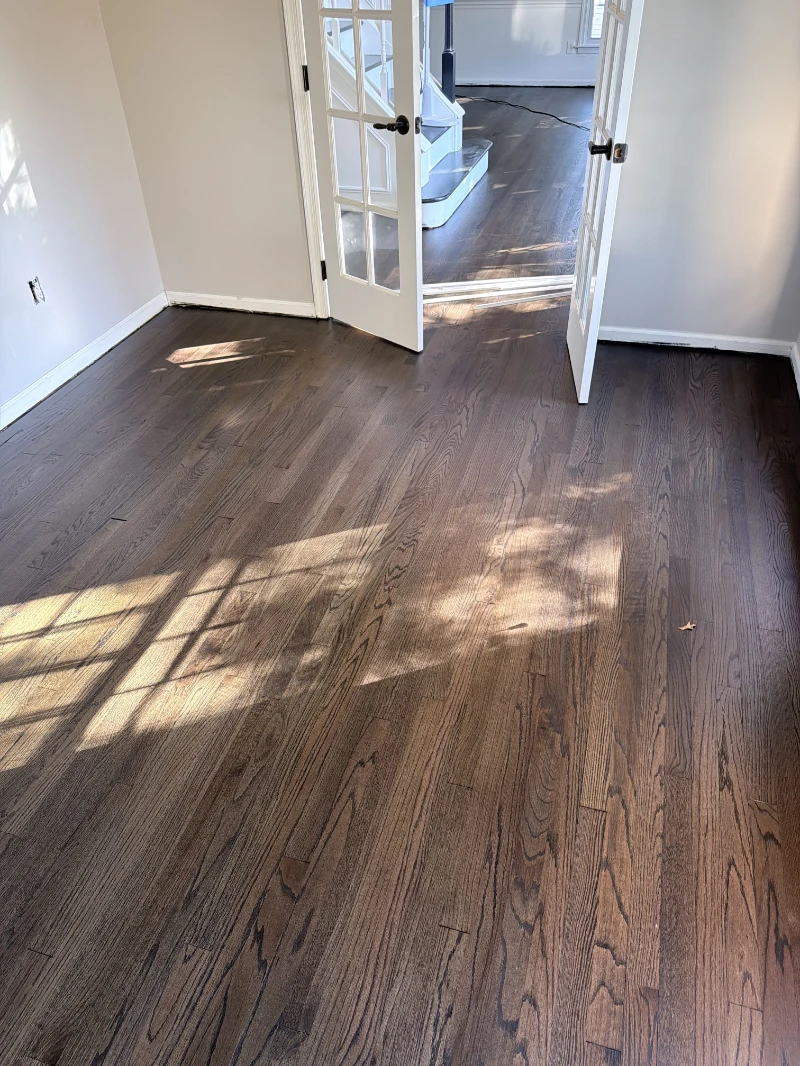
But the range runs from 1938 or earlier to 2004 — which is why the age of the housing decides more about a wood floor here than any regional average can tell you.
Key facts
| Municipalities covered | 185, across 9 New Jersey counties |
|---|---|
| Median year built (range) | 1938 or earlier to 2004 |
| Median across towns | 1964 |
| Pre-1978 share (range) | 17.7% to 94.3% |
| Towns above 60% pre-1978 | 107 of 185 |
| Source | US Census Bureau, ACS 2023 5-Year Estimates |
| Licence | CC BY 4.0 |
Why housing age is the number that matters for a wood floor
It predicts the species, the board width, the subfloor, the finish history and whether lead-safe rules apply — five things that decide how a floor is worked on.
A house built before 1940 is likely to have narrow original boards, possibly heart pine, possibly parquet, and to have been refinished more than once already. What is left of the wear layer is the first question, not the last.
A postwar house is likely to have red oak strip over a wood subfloor, which is the straightforward case. A house built after 1990 is more likely to have engineered or prefinished flooring, where the veneer thickness limits what sanding can do.
None of that is visible from a photograph of a room. It is visible from the year the house was built.
The spread is the point
Two New Jersey towns twenty minutes apart can sit on opposite sides of every one of these thresholds.
Montclair and Maplewood are majority pre-1940. Chesterfield and Upper Freehold are majority post-2000. They are in the same state, under the same building code, in the same climate zone.
This is why we publish the figure per municipality rather than per county or per region. A regional average describes no actual town.
What the derived tiers mean
era_tier, lead_risk and market_tier are classifications we compute from the Census values and use ourselves to decide how a job is approached.
era_tier sorts towns by dominant construction period: historic, prewar_mix, postwar, modern, recent. It maps to what is likely under the finish.
lead_risk flags how much of the stock predates 1978, which is the threshold for the EPA lead-safe rule.
market_tier is simply size by housing units. They are derived, not measured — the underlying data is the Census figures in the same row.
Housing age, by municipality
| Municipality | County | Median year built | % pre-1978 | % pre-1940 | Era tier | Lead risk |
|---|---|---|---|---|---|---|
| Aberdeen | Monmouth County | 1970 | 57.2 | 8.7 | postwar | moderate |
| Allenhurst | Monmouth County | 1938 | 88.2 | 61.7 | historic | high |
| Allentown | Monmouth County | 1954 | 82.8 | 30.5 | prewar_mix | high |
| Asbury Park | Monmouth County | 1959 | 69.8 | 38.1 | historic | moderate |
| Atlantic Highlands | Monmouth County | 1960 | 71.9 | 28.9 | postwar | high |
| Avon-by-the-Sea | Monmouth County | 1948 | 78.1 | 44.2 | historic | high |
| Barnegat Light | Ocean County | 1978 | 50.5 | 5.2 | postwar | moderate |
| Barnegat | Ocean County | 1996 | 26.4 | 3.1 | modern | low |
| Bay Head | Ocean County | 1958 | 66.1 | 37.4 | historic | moderate |
| Bayonne | Hudson County | 1955 | 77.4 | 35.9 | historic | high |
| Beach Haven | Ocean County | 1978 | 49.6 | 10.6 | postwar | moderate |
| Beachwood | Ocean County | 1976 | 55.3 | 5.7 | postwar | moderate |
| Belleville | Essex County | 1949 | 84.1 | 35.4 | historic | high |
| Belmar | Monmouth County | 1959 | 74.9 | 27.7 | prewar_mix | high |
| Berkeley Heights | Union County | 1965 | 71.5 | 4.6 | postwar | high |
| Berkeley | Ocean County | 1980 | 44.8 | 3.0 | modern | moderate |
| Bernards | Somerset County | 1987 | 26.9 | 4.1 | modern | low |
| Bloomfield | Essex County | 1950 | 80.7 | 38.0 | historic | high |
| Bordentown | Burlington County | 1982 | 46.2 | 2.4 | modern | moderate |
| Bound Brook | Somerset County | 1955 | 73.3 | 25.7 | prewar_mix | high |
| Bradley Beach | Monmouth County | 1970 | 65.2 | 29.3 | postwar | moderate |
| Branchburg | Somerset County | 1985 | 34.1 | 6.5 | modern | low |
| Brick | Ocean County | 1976 | 54.5 | 2.9 | postwar | moderate |
| Bridgewater | Somerset County | 1981 | 47.0 | 4.8 | modern | moderate |
| Brielle | Monmouth County | 1963 | 72.5 | 15.9 | postwar | high |
| Caldwell | Essex County | 1958 | 75.0 | 28.8 | prewar_mix | high |
| Carteret | Middlesex County | 1960 | 70.3 | 13.9 | postwar | high |
| Chesterfield | Burlington County | 2004 | 20.1 | 6.6 | recent | low |
| Clark | Union County | 1962 | 79.8 | 3.0 | postwar | high |
| Colts Neck | Monmouth County | 1980 | 45.9 | 6.2 | modern | moderate |
| Cranbury | Middlesex County | 1987 | 37.4 | 16.4 | modern | low |
| Cranford | Union County | 1951 | 85.4 | 30.8 | prewar_mix | high |
| Deal | Monmouth County | 1938 | 81.1 | 51.3 | historic | high |
| Dunellen | Middlesex County | 1952 | 83.3 | 40.3 | historic | high |
| Eagleswood | Ocean County | 1973 | 55.8 | 22.6 | postwar | moderate |
| East Brunswick | Middlesex County | 1974 | 55.0 | 4.5 | postwar | moderate |
| East Newark | Hudson County | 1949 | 77.0 | 43.4 | historic | high |
| East Orange | Essex County | 1957 | 74.3 | 29.7 | prewar_mix | high |
| East Windsor | Mercer County | 1976 | 54.5 | 3.2 | postwar | moderate |
| Eatontown | Monmouth County | 1972 | 60.0 | 3.6 | postwar | moderate |
Showing the first 40 of 185 rows. The complete dataset is in the downloads above.
Download the data
Free to use and redistribute with attribution, under CC BY 4.0.
- nj-housing-age-by-town.csv — 17.4 KB
- nj-housing-age-by-town.json — 70.4 KB
Licence: Creative Commons Attribution 4.0. Please credit VGJ Floors Covering and link back to this page.
Method and limitations
US Census Bureau, American Community Survey 2023 5-Year Estimates, tables B01003, B25001, B25034, B25035
- pct_pre_1978 is an ESTIMATE. The Census reports a 1970-1979 bracket rather than a 1978 cut; 80% of that bracket (8 of 10 years) is attributed to the pre-1978 period and added to the older brackets.
- pct_pre_1940 is exact: the B25034 bracket is '1939 or earlier'.
- median_home_year is bottom-coded by the Census at 1938, meaning '1938 or earlier'. Rows where this applies are flagged in median_year_is_bottom_coded.
- era_tier, lead_risk and market_tier are deterministic classifications derived from the Census values, not separate measurements.
Frequently asked questions
How old are homes in New Jersey?
In the 185 municipalities in this dataset, the median year built ranges from 1938 or earlier to 2004, with a median across towns of 1964. Roughly 65% of housing units predate 1978.
Why does the data stop at 1938?
The Census bottom-codes median year built at 1938, meaning '1938 or earlier' rather than an exact year. Rows where this applies are flagged in the dataset.
Is the pre-1978 figure exact?
No, it is an estimate. The Census reports a 1970–1979 bracket rather than a 1978 cut, so 80% of that bracket is attributed to the pre-1978 period. The pre-1940 figure is exact.
Can I use this data on my own site?
Yes. It is published under CC BY 4.0 — use it, reshape it, redistribute it, with attribution and a link back to this page.
Why only 185 municipalities and not all 564?
This dataset covers the municipalities VGJ Floors serves, across nine counties. It is not a statewide dataset and should not be described as one.
How often is this updated?
When the Census publishes a new ACS 5-year release. The period covered is stated on the page and in the file metadata.
Sources & references
- US Census Bureau — American Community Survey 2023 5-Year Estimates — https://www.census.gov/programs-surveys/acs
- US Census Bureau — ACS Table-Based Summary Files (source of the raw values) — https://www2.census.gov/programs-surveys/acs/summary_file/2023/table-based-SF/data/5YRData/
- US EPA — Renovation, Repair and Painting Program (the 1978 threshold) — https://www.epa.gov/lead/renovation-repair-and-painting-program
Want this applied to your own address?
Tell us the town and we will say what the housing age there usually means for a wood floor.
Request a free estimate