
Pre-1978 Housing by County
Across the nine New Jersey counties we serve, the share of housing built before 1978 ranges from 41.9% in Somerset to 77.9% in Union.
That threshold is not arbitrary: it is the line at which the EPA's lead-safe rule applies to any work that disturbs painted surfaces.
Key facts
| Counties covered | 9 (service-area municipalities only) |
|---|---|
| Highest pre-1978 share | Union County — 77.9% |
| Lowest pre-1978 share | Somerset County — 41.9% |
| Weighting | By housing units, not averaged across towns |
| Source | US Census Bureau, ACS 2023 5-Year Estimates |
| Licence | CC BY 4.0 |
Why these numbers are weighted, not averaged
A simple average across municipalities would give a borough of 200 homes the same weight as a city of 130,000.
Weighting by housing units answers the question that actually matters: what fraction of the county's homes fall on the pre-1978 side of the line.
It also changes the ranking. Counties with many small older boroughs look different under a simple average than they do under a weighted one, and the weighted figure is the honest one.
What the 1978 threshold triggers
Work that disturbs painted surfaces in pre-1978 housing falls under the EPA's Renovation, Repair and Painting rule, which requires a certified firm and contained work practices.
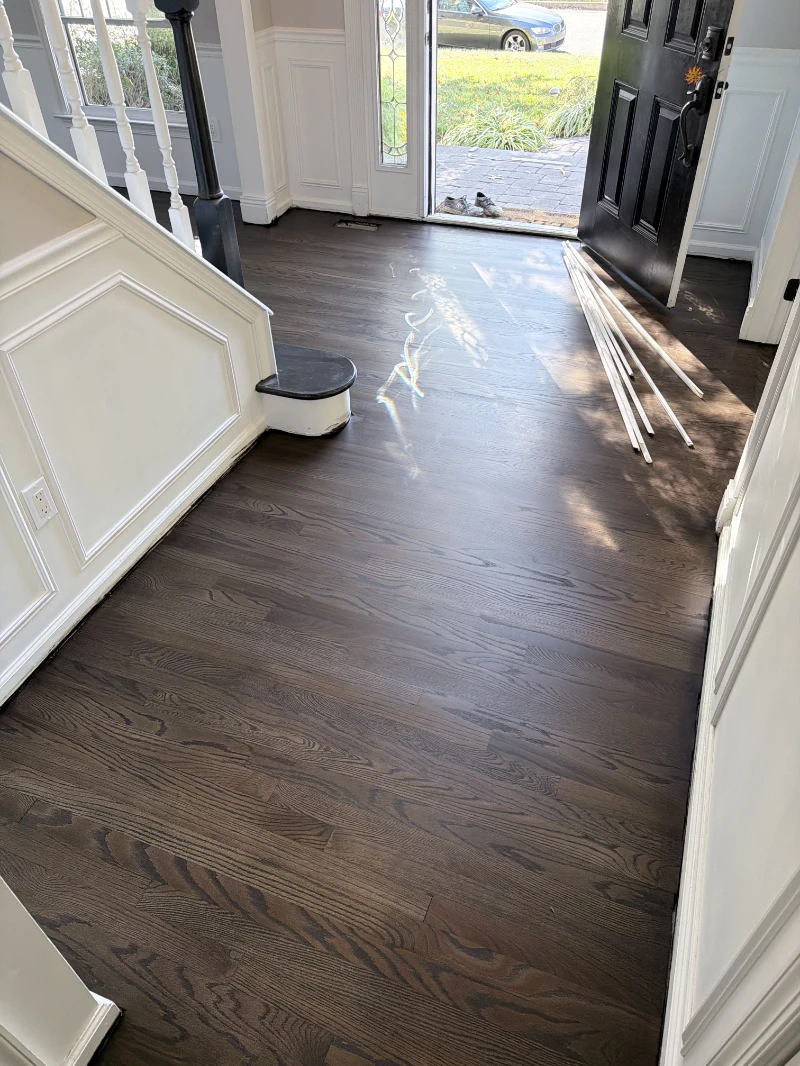
For floor work, the exposure is at the edges: baseboards, shoe molding, thresholds and stair components, which is exactly where sanding equipment runs.
In a county where three quarters of the stock predates 1978, this is the normal condition of a job rather than a special case.
This covers our service area, not whole counties
The figures aggregate only the municipalities we serve within each county, so they are not county-wide statistics.
In Monmouth we serve 54 municipalities; in Burlington, six. Treating either as a county total would misrepresent the data, so the number of municipalities is published alongside every row.
Pre-1978 housing, by county
| County | Municipalities | Housing units | % pre-1978 (wtd) | % pre-1940 (wtd) | Median yr (min) | Median yr (median) | Median yr (max) |
|---|---|---|---|---|---|---|---|
| Hudson County | 12 | 317032 | 61.8 | 29.8 | 1949 | 1963 | 1984 |
| Middlesex County | 25 | 316633 | 55.8 | 10.6 | 1952 | 1967 | 1994 |
| Essex County | 14 | 309300 | 72.9 | 29.6 | 1938 | 1956 | 1966 |
| Ocean County | 32 | 290941 | 45.0 | 4.2 | 1954 | 1976 | 1996 |
| Monmouth County | 54 | 274165 | 54.8 | 13.8 | 1938 | 1964 | 2000 |
| Union County | 20 | 210500 | 77.9 | 24.2 | 1950 | 1955 | 1965 |
| Mercer County | 10 | 142828 | 63.7 | 19.1 | 1938 | 1965 | 1992 |
| Somerset County | 12 | 110807 | 41.9 | 7.9 | 1955 | 1985 | 1993 |
| Burlington County | 6 | 29781 | 47.5 | 8.5 | 1972 | 1994 | 2004 |
Download the data
Free to use and redistribute with attribution, under CC BY 4.0.
- nj-housing-age-by-county.csv — 0.6 KB
- nj-housing-age-by-county.json — 3.8 KB
Licence: Creative Commons Attribution 4.0. Please credit VGJ Floors Covering and link back to this page.
Method and limitations
US Census Bureau, American Community Survey 2023 5-Year Estimates, tables B01003, B25001, B25034, B25035
- pct_pre_1978 is an ESTIMATE. The Census reports a 1970-1979 bracket rather than a 1978 cut; 80% of that bracket (8 of 10 years) is attributed to the pre-1978 period and added to the older brackets.
- pct_pre_1940 is exact: the B25034 bracket is '1939 or earlier'.
- median_home_year is bottom-coded by the Census at 1938, meaning '1938 or earlier'. Rows where this applies are flagged in median_year_is_bottom_coded.
- era_tier, lead_risk and market_tier are deterministic classifications derived from the Census values, not separate measurements.
- County percentages are weighted by housing units, not averaged across municipalities, so a town of 200 homes does not carry the same weight as a city of 130,000.
- Counts cover only the municipalities in the VGJ Floors service area, not the entire county.
Frequently asked questions
Which New Jersey county has the oldest housing?
Of the nine counties in this dataset, Union has the highest share of pre-1978 housing at 77.9% weighted by housing units, followed by Essex at 72.9%.
Why does 1978 matter?
It is the year lead-based paint was banned for residential use in the United States. Work disturbing painted surfaces in older housing falls under the EPA's lead-safe rule.
Are these full county figures?
No. They cover only the municipalities within each county that VGJ Floors serves. The count of municipalities is shown in every row.
How is the weighted percentage calculated?
Each municipality's percentage is multiplied by its housing units, summed across the county, and divided by total housing units — so larger towns carry proportionally more weight.
Can I cite these figures?
Yes, under CC BY 4.0 with attribution and a link back. Please also state the period and note that coverage is service-area municipalities.
Sources & references
- US Census Bureau — American Community Survey 2023 5-Year Estimates — https://www.census.gov/programs-surveys/acs
- US EPA — Renovation, Repair and Painting Program — https://www.epa.gov/lead/renovation-repair-and-painting-program
Want this applied to your own address?
Tell us the town and we will say what the housing age there usually means for a wood floor.
Request a free estimate